Swiss Voting Patterns: Linear Projection with PCA
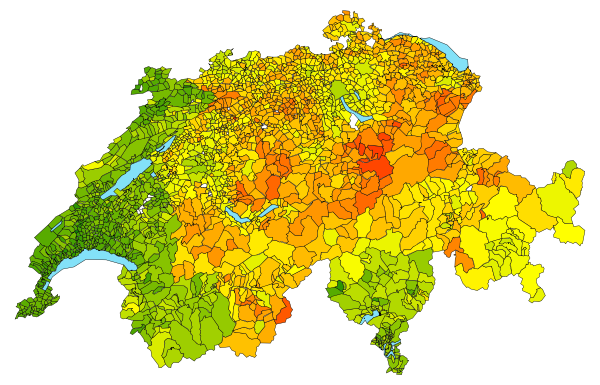
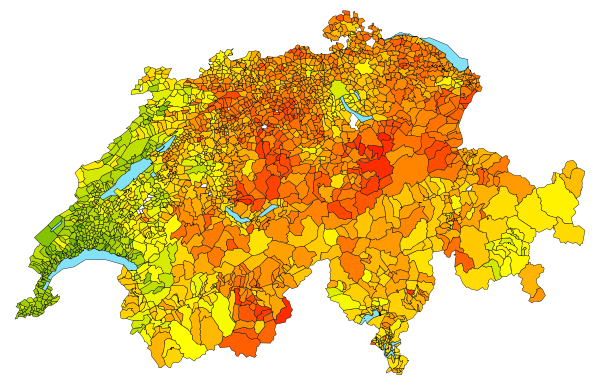
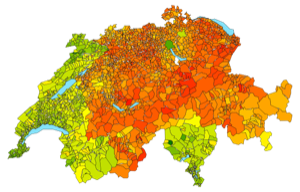
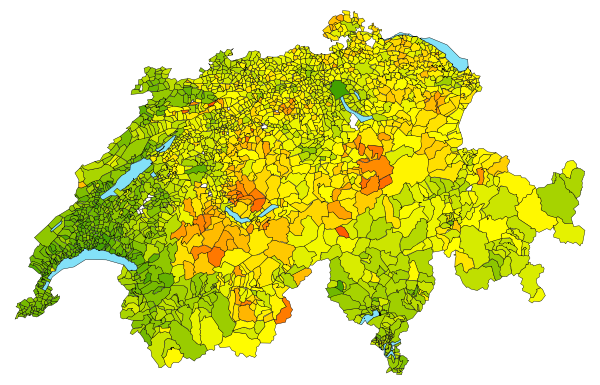
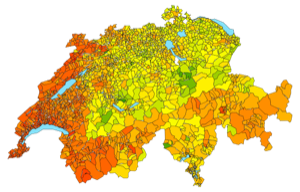
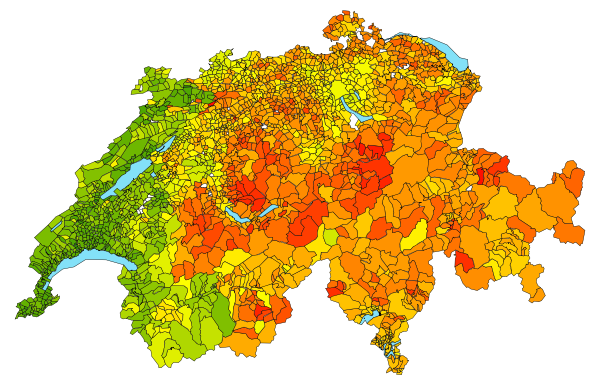
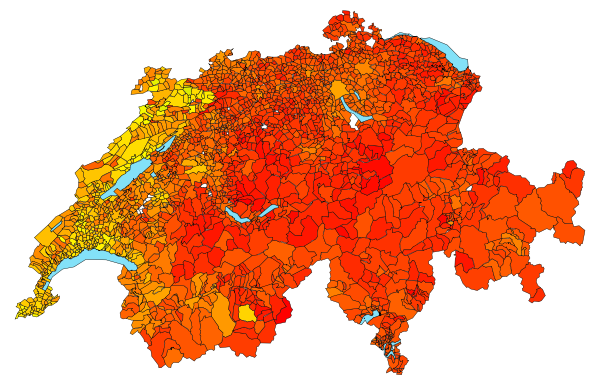
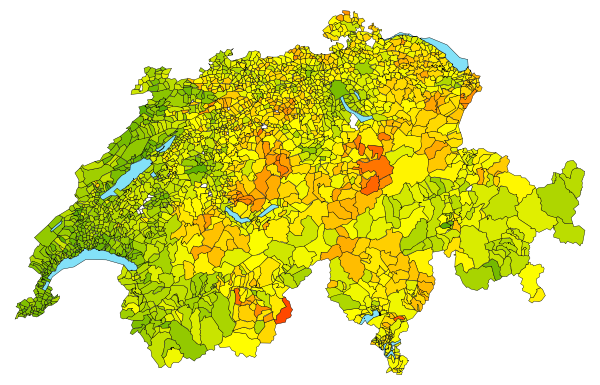
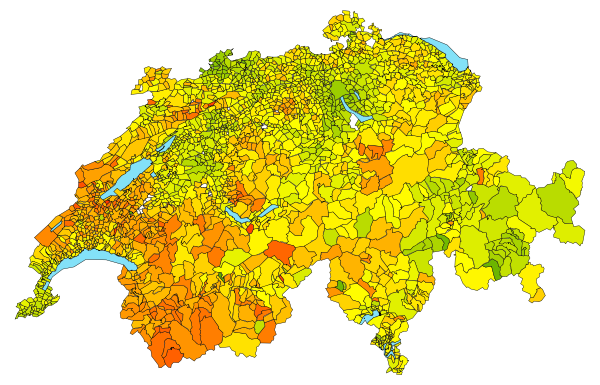
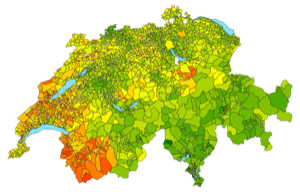
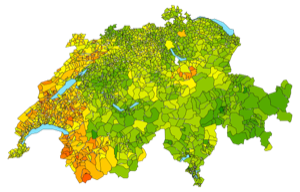
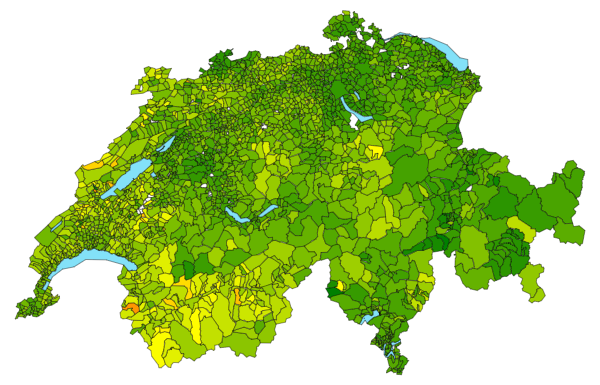
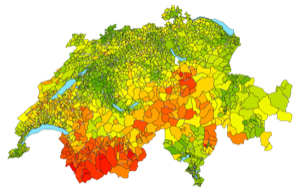
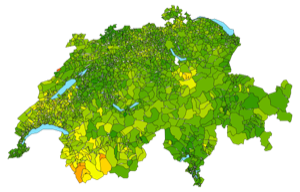
On the Swiss map below, each municipality is shown with a color that represents its voting habits as obtained by a linear projection through "principal component analysis" (PCA), from 1981 until today. Two municipalities with similar colors have similar voting habits, i.e., they are close to each other in the scatter plot. Observe for instance the differences between urban centers and rural areas, or between the different linguistic regions.
Explanation
On the scatter plot above, each municipality is shown by a dot. This representation is obtained directly from all the results to national-level referendum votes, using a dimensionality reduction technique called "principal component analysis" (PCA). On the Swiss map above, the color of each municipality is directly determined by its position in the two-dimensional scatter plot. Overall, two municipalities are close to each other in this space if they vote similarly. The axes of capture the topics and trends that most divided the municipalities during past votes. The first axis (horizontal) mainly represents themes associated to the openness of Switzerland, as well as social insurances. The second axis (vertical) mainly represents themes associated to transports, environment and agriculture. Below, we provide interpretations of these axes in terms of the most important votes that they represent.
Composition of the Axes
In the following tables, we show the most important votes represented by the two axes. The importance of each vote, illustrated on the right side of the list, indicates on which side of the axis the yes is located. If a vote has its importance directed to the right, it means that the municipalities that voted "yes" on this issue will tend to be represented on the right (for the horizontal axis), or at the top (for the vertical axis). Conversely, municipalities voting "yes" to a vote having its importance directed to the left will tend to be represented more on the left (for the horizontal axis), or at the bottom (for the vertical axis).